Published on: August 2, 2026By: Elad BushariCategory: Market Updates
July 2026 Brookline real estate: 52 homes sold at an average of $1.49M. Condo and single family breakdowns, neighborhood analysis, buyer and seller insights.
Homes Sold 52 ▼ 23.5% YoY
Average Sale Price $1,494,433 ▼ 7.5% YoY
Avg Price/SqFt $803 ▼ 1.4% YoY
Avg Days on Market 41.6 ▲ 10.6% YoY
Active Inventory 192 ▼ 11.5% YoY
Months of Supply 3.8 ▲ 18.8% YoY
Market Overview
Brookline’s residential market in July 2026 delivered a paradox: headline prices climbed while transaction volume dropped sharply. The town recorded 52 closed sales — down 23.5% from 68 in July 2025 — at a median price of $1,420,000, an 18.3% year-over-year increase. However, the more reliable per-square-foot metric tells a more tempered story: average price per square foot slipped 1.4% to $803, suggesting that the median price surge is largely compositional rather than reflective of broad-based appreciation. Condominiums dominated the mix, accounting for 43 of 52 sales, and their median price jumped 26.1% to $1,257,500 — pulling the townwide median higher.
At 3.8 months of supply (up from 3.2 a year ago), the market sits just below the 4-month threshold that typically separates seller-favorable from balanced conditions. But the details reveal a more nuanced picture. Nearly 60% of sales closed below asking price, 32.7% of listings had price reductions, and average days on market stretched to 41.6 from 37.6 a year ago. Buyers are finding more room to negotiate than the headline price figures suggest. As noted in our Q2 2026 quarterly report, this tension between rising prices and softening demand signals has been building throughout the year.
An important caveat: the single-family segment recorded only 9 sales this month, and its average price per square foot of $536 is a dramatic outlier likely driven by the mix of properties that happened to close rather than genuine depreciation. Readers should interpret single-family metrics directionally only. The multifamily segment had just 1 sale and is anecdotal at best.
Sales Volume Trend
Brookline Closed Sales — 13-Month TrendTownwide residential closed sales (single-family + condo), July 2025 through July 2026.
Jul 2025 68 68
Aug 2025 50 50
Sep 2025 45 45
Oct 2025 44 44
Nov 2025 32 32
Dec 2025 37 37
Jan 2026 28 28
Feb 2026 16 16
Mar 2026 36 36
Apr 2026 47 47
May 2026 63 63
Jun 2026 59 59
Jul 2026 52 52
View chart data
Period
Closed Sales
Jul 2025
68
Aug 2025
50
Sep 2025
45
Oct 2025
44
Nov 2025
32
Dec 2025
37
Jan 2026
28
Feb 2026
16
Mar 2026
36
Apr 2026
47
May 2026
63
Jun 2026
59
Jul 2026
52
July’s 52 closings represent the lowest July total in the 13-month dataset and a notable step down from the spring peak of 63 sales in May. The seasonal pattern — a spring ramp-up followed by a summer plateau — is typical, but the year-over-year decline of 23.5% is steeper than seasonal norms alone would explain. With mortgage rates persisting in the mid-6% range, rate-sensitive buyers continue to sit on the sidelines.
Average Sale Price Trend
Brookline Average Sale Price — 13-Month TrendTownwide residential average sale price (single-family + condo), July 2025 through July 2026.
Jul 2025 1615684 $1.62M
Aug 2025 1576375 $1.58M
Sep 2025 1526667 $1.53M
Oct 2025 1194580 $1.19M
Nov 2025 1780531 $1.78M
Dec 2025 1972932 $1.97M
Jan 2026 1855204 $1.86M
Feb 2026 1590063 $1.59M
Mar 2026 1935077 $1.94M
Apr 2026 1758074 $1.76M
May 2026 1606992 $1.61M
Jun 2026 1568778 $1.57M
Jul 2026 1494433 $1.49M
View chart data
Period
Avg Sale Price
Jul 2025
$1,615,684
Aug 2025
$1,576,375
Sep 2025
$1,526,667
Oct 2025
$1,194,580
Nov 2025
$1,780,531
Dec 2025
$1,972,932
Jan 2026
$1,855,204
Feb 2026
$1,590,063
Mar 2026
$1,935,077
Apr 2026
$1,758,074
May 2026
$1,606,992
Jun 2026
$1,568,778
Jul 2026
$1,494,433
July’s average sale price of $1,494,433 is the lowest since October 2025’s $1,194,580 and represents a 7.5% decline from July 2025’s $1,615,684. The downward trend from the December 2025 peak of $1,972,932 reflects the seasonal shift in mix as more moderately priced condos dominate summer closings. With only 9 single-family sales pulling the average down, the composition of any given month’s closings can swing this figure substantially.
Year-over-Year Comparison
Year-over-Year Comparison: July 2025 vs. July 2026Key townwide metrics comparing July 2025 and July 2026.
Avg Sale Price — Jul 2025 1615684 $1,615,684
Avg Sale Price — Jul 2026 1494433 $1,494,433
Avg $/SqFt — Jul 2025 814.3 $814
Avg $/SqFt — Jul 2026 802.56 $803
Avg DOM — Jul 2025 37.6 37.6 days
Avg DOM — Jul 2026 41.6 41.6 days
Sale-to-List — Jul 2025 0.9968 99.68%
Sale-to-List — Jul 2026 0.9969 99.69%
Active Inventory — Jul 2025 217 217
Active Inventory — Jul 2026 192 192
View chart data
Metric
Jul 2025
Jul 2026
Change
Avg Sale Price
$1,615,684
$1,494,433
-7.5%
Avg $/SqFt
$814
$803
-1.4%
Avg DOM
37.6
41.6
+10.6%
Sale-to-List Ratio
99.68%
99.69%
Flat
Active Inventory
217
192
-11.5%
The year-over-year comparison reveals a market that is softening at the margins rather than shifting dramatically. Average price per square foot dipped just 1.4% to $803 — a far more reliable gauge of underlying value than the median price, which is heavily influenced by the mix of properties closing in any given month. The sale-to-list ratio is virtually unchanged at 99.69%, meaning sellers are still getting very close to their asking prices on average, though this masks the 59.6% of sales that closed below asking (up slightly from 58.8%).
The most telling shift is in velocity and inventory dynamics. Average days on market stretched to 41.6 from 37.6, and active inventory dropped 11.5% to 192 listings. Fewer new listings are entering the market, but absorption has slowed even more — pushing months of supply from 3.2 to 3.8. The market remains technically seller-favorable below the 4-month threshold, but the trajectory is clearly moving toward balance. For buyers searching for homes for sale in Brookline MA, the negotiating environment is modestly better than it was a year ago.
The Brookline Condo Market
Condos Sold 43 ▼ 14.0% YoY
Avg Sale Price $1,337,919 ▲ 13.4% YoY
Avg Price/SqFt $858 ▲ 3.4% YoY
Months of Supply 3.1 Flat YoY
Condominiums were the clear engine of Brookline’s July market, accounting for 43 of 52 total sales. The segment showed genuine strength: average price per square foot rose 3.4% year-over-year to $858, confirming real per-foot appreciation rather than just compositional noise. The median condo price surged 26.1% to $1,257,500 — the highest in the 13-month trend — though some of this reflects a shift toward higher-end units in the sales mix. Average sale price climbed 13.4% to $1,337,919 from $1,179,690 a year ago.
Demand signals remain robust for condos for sale in Brookline. A notable 41.9% of condos sold over asking price (up from 26% in July 2025), and the average sale-to-list ratio of 1.0013 means the typical condo buyer paid slightly above list. Median days on market improved to 23 from 35 a year ago, and 55.8% of condos sold within 30 days — up from 46%. Price reductions dropped to 27.9% from 44%, indicating that sellers are pricing more accurately or that demand is absorbing listings before adjustments become necessary.
With months of supply holding tight at 3.1 (essentially unchanged from 3.1 a year ago) and 131 active listings, the condo market remains firmly in seller’s territory. The median condo fee of $586 is the lowest in the 13-month window, which may be contributing to net affordability and sustaining buyer interest. At the current 6.51% mortgage rate with 20% down, a median-priced condo at $1,257,500 carries an estimated $6,365/month in principal and interest, rising to approximately $6,951 when the median condo fee is included.
The Brookline Single Family Market
Homes Sold 9 ▼ 50.0% YoY
Avg Sale Price $2,242,222 ▼ 20.7% YoY
Avg Price/SqFt $536 ▼ 30.5% YoY
Months of Supply 6.9 ▲ 81.6% YoY
Only 9 single family homes closed in July 2026, half the 18 recorded in July 2025. With a sample this small, all metrics should be interpreted directionally rather than as definitive market signals. The average price per square foot of $536 is a striking anomaly — the lowest in the 13-month trend and down 30.5% from $771 a year ago. This almost certainly reflects the specific mix of properties that closed (likely larger-footprint or less-renovated homes) rather than genuine depreciation of Brookline’s single-family housing stock.
The buyer-favorable dynamics are unmistakable, however. A full 88.9% of single-family sales closed below asking price, 55.6% had price reductions, and only 11.1% sold within 30 days. Median days on market nearly doubled to 42 from 23.5 in July 2025. The average sale-to-list ratio of 0.9764 indicates sellers conceded roughly 2.4% on average. With 61 active listings and 6.9 months of supply — up sharply from 3.8 a year ago — the single-family segment has crossed firmly into buyer’s market territory.
The median single-family price of $2,325,000 was essentially flat year-over-year (down just 1.3% from $2,355,500), suggesting that while buyers have more leverage on negotiations and timing, the fundamental floor on Brookline single-family pricing remains intact. At the current 6.51% rate, a buyer putting 20% down on the median-priced single-family home faces an estimated $11,769/month in principal and interest alone — a significant carrying cost that helps explain why volume has contracted so sharply in this segment.
* Fewer than 5 sales; too few to draw conclusions. Interpret directionally only.
Coolidge Corner led all neighborhoods with 18 sales, though volume was down sharply from 35 in July 2025. The median price of $1,442,500 represented a 25.4% year-over-year increase, but average price per square foot of $859 was down modestly from $883, suggesting the headline price gain reflects a shift in the mix of units trading rather than broad per-foot appreciation. With 38.9% of sales closing over asking and a 29-day median DOM, demand in Brookline’s most active neighborhood remains solid. The revised 96-unit proposal at 26 Pleasant Street and the ongoing Centre Street parking lot study continue to shape the development outlook for this neighborhood.
Brookline Village posted 15 sales at a median of $1,550,000 — up 55.4% from $997,500 a year ago — but the details tell a more complex story. Median DOM ballooned to 54 days from 19, the sale-to-list ratio dropped to 0.985, and only 20% sold over asking (down from 33.3%). Average price per square foot of $866 did jump 18% year-over-year, the strongest per-foot gain among neighborhoods with adequate sample sizes, suggesting genuine appreciation alongside the compositional shift.
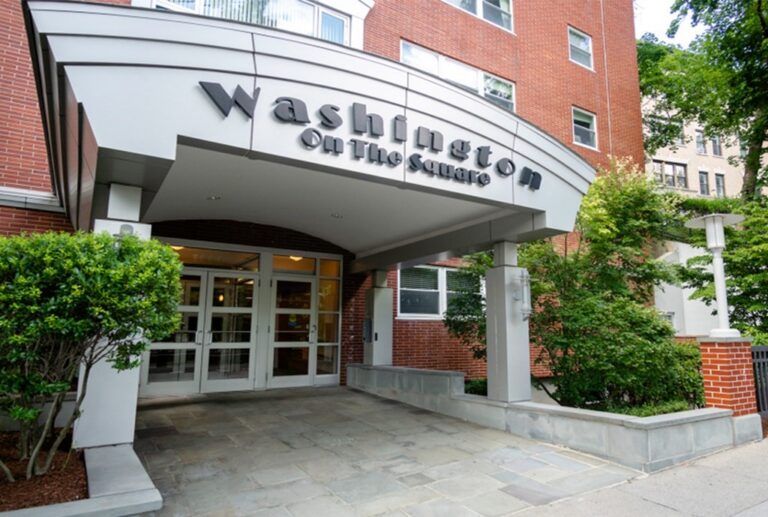
Washington Square was the fastest-moving neighborhood with a 16-day median DOM on 5 sales. The median price of $1,450,000 was essentially flat year-over-year, and 40% sold over asking with a sale-to-list ratio of 1.009 — confirming that well-priced properties in this walkable, transit-accessible neighborhood continue to attract competitive offers.
Among school zones, the Ridley zone led with 10 sales at a median of $1,949,000, while the Pierce zone posted the highest average price per square foot at $964. The Lawrence zone saw the most dramatic velocity improvement, with median DOM dropping from 35 to 16 days and 57.1% of sales closing over asking. The Lincoln zone stood out as a buyer’s market pocket: 6 sales with zero over asking, a 60.5-day median DOM, and a sale-to-list ratio of 0.973. The Baker zone shifted from 0% over asking in July 2025 to 40% this July, suggesting improved demand despite a modest 4.4% median price decline. The Hayes zone recorded only 2 sales (n=2, too few to draw conclusions), with a lengthy 74.5-day median DOM.
Frequently Asked Questions for Buyers
Is now a good time to buy in Brookline?
It depends on the segment. The condo market remains competitive with 3.1 months of supply and 41.9% of sales closing over asking, so condo buyers still face competition on well-priced listings. The single-family market, however, has shifted meaningfully in buyers’ favor: 6.9 months of supply, 88.9% of sales closing below asking, and 55.6% with price reductions. If you’re targeting a single-family home, you have more negotiating leverage than at any point in the past 13 months. The tradeoff is that mortgage rates near 6.51% mean carrying costs remain elevated.
How much should I offer below asking in Brookline right now?
The townwide average sale-to-list ratio is 99.69%, meaning the typical property sells within a fraction of a percent of its asking price. But this average masks significant variation. For condos, the average sale-to-list is 100.13% — meaning many condos sell at or above asking. For single-family homes, the ratio drops to 97.64%, indicating sellers are conceding roughly 2.4% on average. In the Lincoln school zone, the sale-to-list ratio is just 97.31%. Your offer strategy should be calibrated to the specific property type, neighborhood, and how long the listing has been on market.
What’s the best Brookline neighborhood for first-time buyers right now?
Buyers looking for relative value should consider areas within the Lincoln school zone, where the median sale price was $649,000 with no sales closing over asking and a 60.5-day median DOM — giving buyers time and leverage. The Runkle zone also showed a median of $793,000 with a fast 21-day DOM. For condos specifically, Coolidge Corner offers the deepest inventory and a median of $1,442,500, though competition remains with 38.9% selling over asking. Browse current Brookline MA homes for sale to see what’s available in each area.
Should I wait for mortgage rates to drop before buying?
At the current 6.51% rate, a median-priced Brookline home at $1,420,000 requires approximately $7,188/month in principal and interest with 20% down. If rates were to drop a full percentage point, that payment would decrease meaningfully — but lower rates would also bring more buyers off the sidelines, potentially increasing competition and pushing prices higher. The current environment of 192 active listings and 3.8 months of supply offers more selection than Brookline has seen in recent years. Timing the rate market is inherently uncertain; buying when you find the right property at a price you can sustain is generally the more reliable strategy.
How long are homes sitting on the market in Brookline?
The townwide average is 41.6 days, up from 37.6 a year ago. But the gap between segments is dramatic: condos average 41.1 days with a 23-day median, while single-family homes average 44 days with a 42-day median. In the fastest-moving neighborhoods — Washington Square and the Lawrence school zone — the median DOM is just 16 days. In the Lincoln zone, it stretches to 60.5 days. Only 5.8% of all sales went under contract within 7 days, down from 7.4% a year ago, indicating reduced urgency among buyers overall.
Are sellers negotiating on closing costs or repairs?
The data suggests increasing seller flexibility. Nearly 60% of sales closed below asking, and 32.7% of listings had price reductions (down from 38.2% a year ago, but still significant). In the single-family segment, 55.6% of listings had price reductions. While the MLS data doesn’t capture closing-cost concessions or repair credits directly, the below-asking closing rates and extended days on market indicate that buyers — particularly in the single-family segment — are in a position to negotiate beyond just price.
Frequently Asked Questions for Sellers
Is this a good time to list my Brookline home?
For condo owners, the market remains favorable. With 3.1 months of supply, 41.9% of condos selling over asking, and an average sale-to-list ratio above 1.0, well-priced condos are still attracting competitive offers. For single-family homeowners, the picture is more challenging: 6.9 months of supply and 88.9% of sales closing below asking mean you’ll need to price strategically and be prepared for longer marketing times. That said, active inventory dropped 19% from June to July (237 to 192), so sellers who list now face less competition from other listings than they did a month ago.
How should I price my home in the current market?
Pricing accuracy is critical. The 32.7% of listings with price reductions tells you that overpricing is still a common mistake. In the condo segment, the average sale-to-list ratio of 1.0013 means pricing at or slightly below market value can generate competitive offers. For single-family homes, the 97.64% sale-to-list ratio means you should expect to close roughly 2-3% below your asking price. Work with experienced Brookline real estate agents who understand the micro-market dynamics of your specific neighborhood and property type.
How long will it take to sell my Brookline home?
The townwide average is 41.6 days on market, but your timeline depends heavily on property type and pricing. Condos in Washington Square and the Lawrence school zone are moving in a median of 16 days. Single-family homes are averaging 44 days, with a median of 42. Properties in the Lincoln zone are taking a median of 60.5 days. Only 48.1% of all sales closed within 30 days, so sellers should plan for a marketing period of at least 4-6 weeks and potentially longer if the initial pricing misses the market.
Should I do repairs or staging before listing?
In a market where 59.6% of sales close below asking and buyers have more leverage than a year ago, presentation matters more than ever. The data shows a clear bifurcation: well-positioned properties in desirable locations are still generating competitive offers (36.5% sold over asking townwide), while properties that linger accumulate price reductions and sell at deeper discounts. Staging and targeted repairs can help your property land in the first category rather than the second — particularly in the single-family segment where 55.6% of listings had price reductions.
Should I wait until next spring to list?
The spring market typically brings both more buyers and more competing listings. July’s 192 active listings are down from the spring peak of 247 in April, meaning sellers listing now face less competition. However, volume is also lower — 52 sales versus the spring peak of 63 in May. If you’re a condo seller, the current 3.1 months of supply and over-asking dynamics suggest there’s no compelling reason to wait. Single-family sellers face a tougher call: the 6.9 months of supply is elevated, but waiting introduces uncertainty around rates, inventory levels, and broader economic conditions.
Looking Ahead
Several dynamics bear watching as Brookline moves into late summer and fall. The rental market is flashing the clearest softening signal: available rental inventory has tripled year-over-year to 465 units, lease volume dropped 32.9% to 112, and median rent slipped 2.6% to $3,700. The recent decision by a Chestnut Hill luxury building to drop its 55+ age restriction after leasing struggles is emblematic of the broader shift toward tenant-favorable conditions. With the September turnover season approaching, landlords should prepare for continued competition for tenants. The pending Brookline rent stabilization legislation adds another layer of uncertainty for rental property owners.
On the sales side, the single-family volume collapse — 9 sales is the second-lowest monthly count in the 13-month window — warrants close monitoring. August data will clarify whether this is a one-month anomaly or the beginning of a structural pullback driven by affordability constraints. At $11,769/month in estimated principal and interest for the median single-family home, the pool of qualified buyers is inherently limited at current rates. Meanwhile, the condo median price of $1,257,500 is at a 13-month high; watch whether this represents a new plateau or reverts toward the $900,000-$1,100,000 range that characterized much of the past year. Active inventory dropped 19% from June to July (237 to 192), and if new listings continue to dry up, expect further price support despite declining volume.
For those considering moving to Brookline MA, the current market offers a wider range of options and more negotiating room than buyers have seen in recent years — particularly in the single-family segment and in school zones like Lincoln where buyer leverage is most pronounced. Forecasts are based on current data and trends; actual outcomes may vary.
Source: MLS PIN, Brookline real estate transactions through July 31, 2026.
About Elad Bushari
Elad Bushari is a Brookline, Massachusetts real estate advisor, Executive Vice President at Compass, and founder of The Bushari Team. With more than 22 years of experience and over $1 billion in career sales, Elad specializes in Brookline real estate, luxury homes, condominiums, multi-family properties, development sales, and strategic representation.
Based in Brookline, Elad advises buyers, sellers, landlords, tenants, and developers across Coolidge Corner, Washington Square, Chestnut Hill, Fisher Hill, Brookline Village, Longwood, and Greater Boston. His work combines hyperlocal market knowledge, data-driven pricing strategy, high-end marketing, negotiation experience, and deep familiarity with Brookline’s housing stock, condo buildings, schools, zoning, and neighborhood dynamics.
Elad writes about Brookline real estate market trends, housing policy, condo due diligence, private listing strategy, older-home risk, luxury property marketing, and local buyer and seller strategy on Bushari.com.
A proposed Massachusetts law aims to prevent artist displacement. What the Creative Space Act could mean for Brookline's mixed-use corridors and housing.




 Sold
Sold