
Brookline schools and housing
The short answer
John Pierce: school information and housing context
This guide pairs the official school profile with residential transactions carrying the John Pierce market classification. That classification is useful market context, but it is not an official assignment; verify the exact address directly with Public Schools of Brookline.
Official school reference
John Pierce School
John Pierce School is a Public Schools of Brookline K–8 school currently operating at separate K–5 and grades 6–8 campuses. This page pairs current official school reference information with real-estate evidence for properties classified in the Pierce market area.
Grades
K–8
Address
K–5: 194 Boylston Street; grades 6–8: 150 Fisher Avenue, Brookline, MA
(617) 730-2580 (K–5); (617) 730-2581 (grades 6–8)
Official source
Visit the official school page
Facts reviewed July 19, 2026
Address-specific assignment
Verify the exact address with Public Schools of Brookline.
Neighborhood names and Bushari market classifications do not determine enrollment. Attendance areas and buffer-zone rules can make assignment address-specific, and the school district—not Bushari—makes the official determination.
Current homes for sale
Homes currently classified in the John Pierce School market area
These active residential listings carry Bushari's primary school-market classification. This is a property-search aid, not an enrollment determination. Verify the exact address with Public Schools of Brookline.
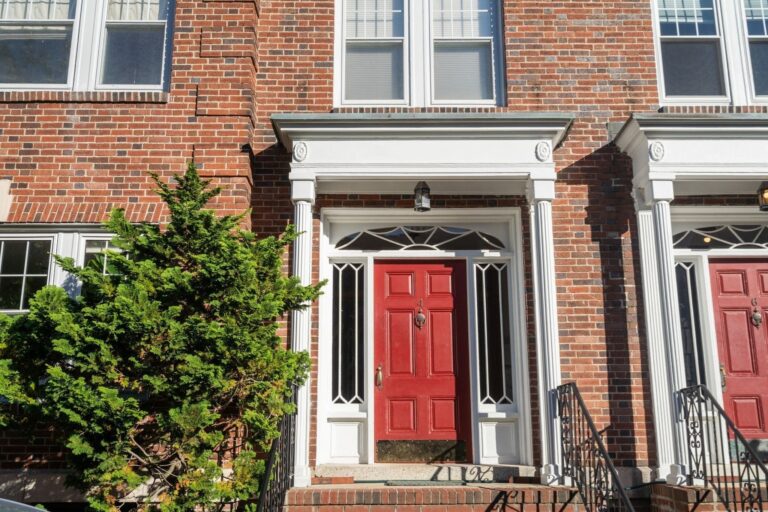 Active
$1,695,000
4 Alton Court #3
4 Beds
2 Baths
1,923 sqft
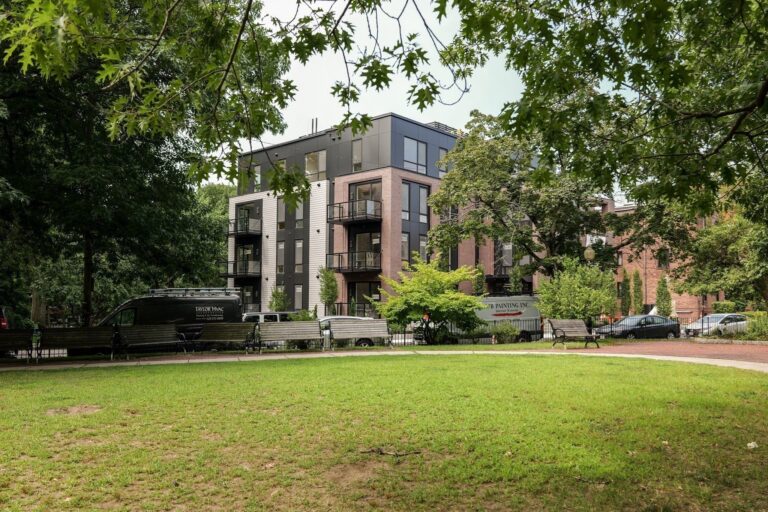 Active
$3,549,000
80 Vernon ##2-B
3 Beds
2.5 Baths
2,125 sqft
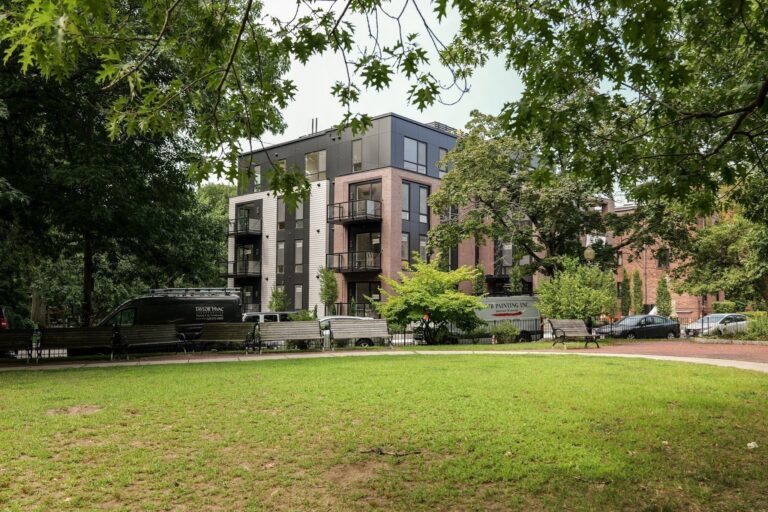 Active
$3,175,000
80 Vernon #PentHouse B
3 Beds
2.5 Baths
1,683 sqft
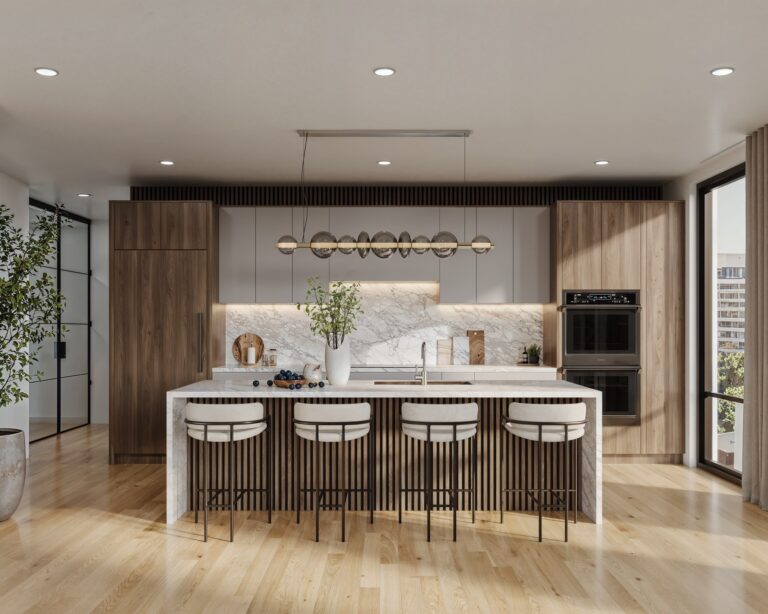 Active
$2,659,000
80 Vernon #Unit 1A
3 Beds
2.5 Baths
1,662 sqft
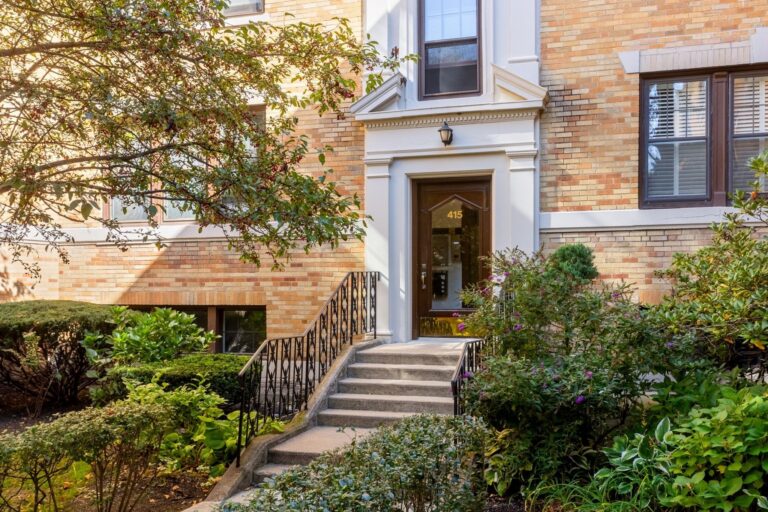 Active
$1,275,000
415 Washington St #6
3 Beds
2 Baths
1,655 sqft
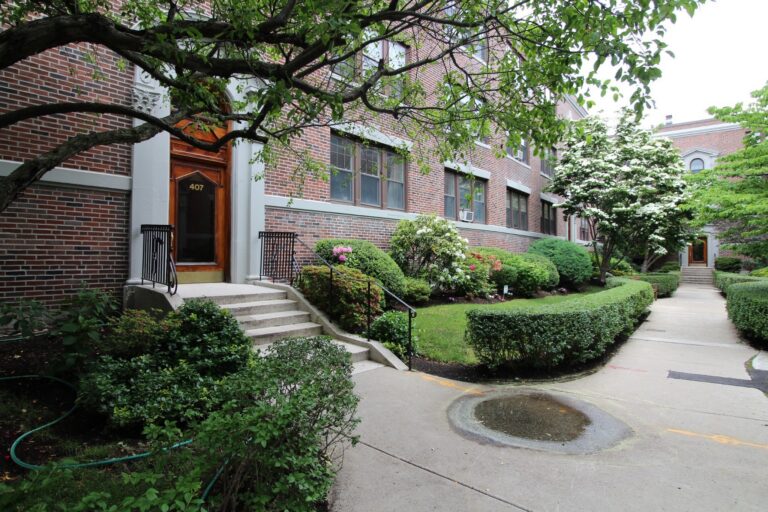 Active
$699,900
407 Washington St #2
2 Beds
1 Baths
900 sqft
Browse all currently listed homes in this market classification
Market interpretation
What changed in the John Pierce market?
Across the 12 complete months ending September 2026, closed sales were up 20.0% year over year. Average sale price was up 2.6% year over year and average price per square foot was up 11.1% year over year.
The latest monthly interpretation is held until its stored Market Report row matches the transaction warehouse.
12-month market pulse
Volume, pricing, and pace by month
These views expose variation hidden by a single annual median. Every observed month shows its calculated descriptive statistics; small samples are disclosed in the methodology and are not used for directional conclusions.
5Oct
6Nov
6Dec
5Jan
4Feb
4Mar
8Apr
12May
11Jun
9Jul
5Aug
3Sep
How the second half compared with the first
| Measure | Oct 2025–Mar 2026 | Apr 2026–Sep 2026 | Change |
|---|---|---|---|
| Closed sales | 30 | 48 | ▲ 60.0% |
| Median sale price | $1.015M | $1.273M | ▲ 25.4% |
| Average price / sq. ft. | $905 | $964 | ▲ 6.5% |
| Sold over asking | 33.3% | 47.9% | ▲ 14.6 pts |
Changes can reflect property mix and seasonality; they are not evidence that every property moved by the same amount.
View the exact monthly data
| Month | Sales | Sale price | $ / sq. ft. | DOM | Sale/list |
|---|---|---|---|---|---|
| Oct 2025 | 5 | Avg $1.116M Median $935,000 | Avg $743 Median $738 | Avg 43.4 Median 10.0 | Avg 100.1% Median 99.2% |
| Nov 2025 | 6 | Avg $1.213M Median $1.075M | Avg $807 Median $816 | Avg 18.0 Median 16.5 | Avg 100.7% Median 98.7% |
| Dec 2025 | 6 | Avg $1.113M Median $800,500 | Avg $888 Median $907 | Avg 47.3 Median 37.0 | Avg 98.1% Median 98.3% |
| Jan 2026 | 5 | Avg $1.685M Median $1.75M | Avg $927 Median $975 | Avg 39.6 Median 23.0 | Avg 104.7% Median 103.0% |
| Feb 2026 | 4 | Avg $1.134M Median $868,500 | Avg $923 Median $878 | Avg 22.0 Median 14.5 | Avg 101.8% Median 99.9% |
| Mar 2026 | 4 | Avg $1.387M Median $1.159M | Avg $1,344 Median $1,407 | Avg 16.8 Median 14.0 | Avg 101.8% Median 98.9% |
| Apr 2026 | 8 | Avg $1.532M Median $1.275M | Avg $1,056 Median $1,148 | Avg 33.1 Median 14.5 | Avg 100.7% Median 100.3% |
| May 2026 | 12 | Avg $1.223M Median $1.205M | Avg $907 Median $888 | Avg 16.1 Median 16.0 | Avg 103.2% Median 102.7% |
| Jun 2026 | 11 | Avg $1.314M Median $1.02M | Avg $928 Median $881 | Avg 30.6 Median 22.0 | Avg 99.7% Median 99.9% |
| Jul 2026 | 9 | Avg $1.551M Median $1.475M | Avg $964 Median $843 | Avg 56.7 Median 49.0 | Avg 99.0% Median 98.3% |
| Aug 2026 | 5 | Avg $1.536M Median $1.35M | Avg $804 Median $760 | Avg 64.6 Median 58.0 | Avg 100.2% Median 100.1% |
| Sep 2026 | 3 | Avg $1.842M Median $1.6M | Avg $1,342 Median $1,315 | Avg 35.0 Median 18.0 | Avg 97.8% Median 97.0% |
Compare like with like
Condominiums and houses are separate comparison sets
Property type, building, condition, parking, outdoor space, and association health can materially change the relevant evidence.
Included sales by property type
Condominium
72
Single-family
6
| Measure | Condominium | Single-family |
|---|---|---|
| Closed sales | 72 | 6 |
| Median sale price | $1.15M | $2.218M |
| Average price / sq. ft. | $930 | $1,113 |
| Median days on market | 18.5 | 19.5 |
| Sold over asking | 41.7% | 50.0% |
Small segment samples are context, not a standalone pricing model.
Decision notes
What the evidence changes for buyers and sellers
For sellers
Build the comparison set before the price
Start with comparable sales in the same property type and verify how each address was classified. School-area evidence can help define the comparison set, but it does not replace property condition, building, parking, outdoor space, or current competition.
Request a property-specific valuationFor buyers
Separate market context from assignment
Use the housing evidence for market context, then verify the exact address with Public Schools of Brookline. A neighborhood label, listing field, or market-zone classification is not an official school assignment.
Ask a Brookline real-estate questionUnderstand the evidence
John Pierce market FAQs
Does this page guarantee assignment to John Pierce?
No. The school-zone label is a real-estate reporting classification, not an enrollment determination. Verify the exact address with Public Schools of Brookline because attendance areas and buffer-zone rules can make assignment address-specific.
What does the John Pierce market area mean?
It is the school-zone classification stored with the MLS-reported residential records used for this analysis. It helps define the market dataset but does not establish an official school boundary.
What period do the John Pierce market statistics cover?
The current page summarizes Oct 2025 – Sep 2026, with verified data through September 30, 2026. The reporting window advances only after the completed monthly data passes the Market Intelligence validation checks.
How should small school-area sales samples be interpreted?
Observed averages and medians are still reported for nonempty months, but months with fewer than five residential closings are descriptive only. They are excluded from directional conclusions and stable peer comparisons.
Property-specific analysis