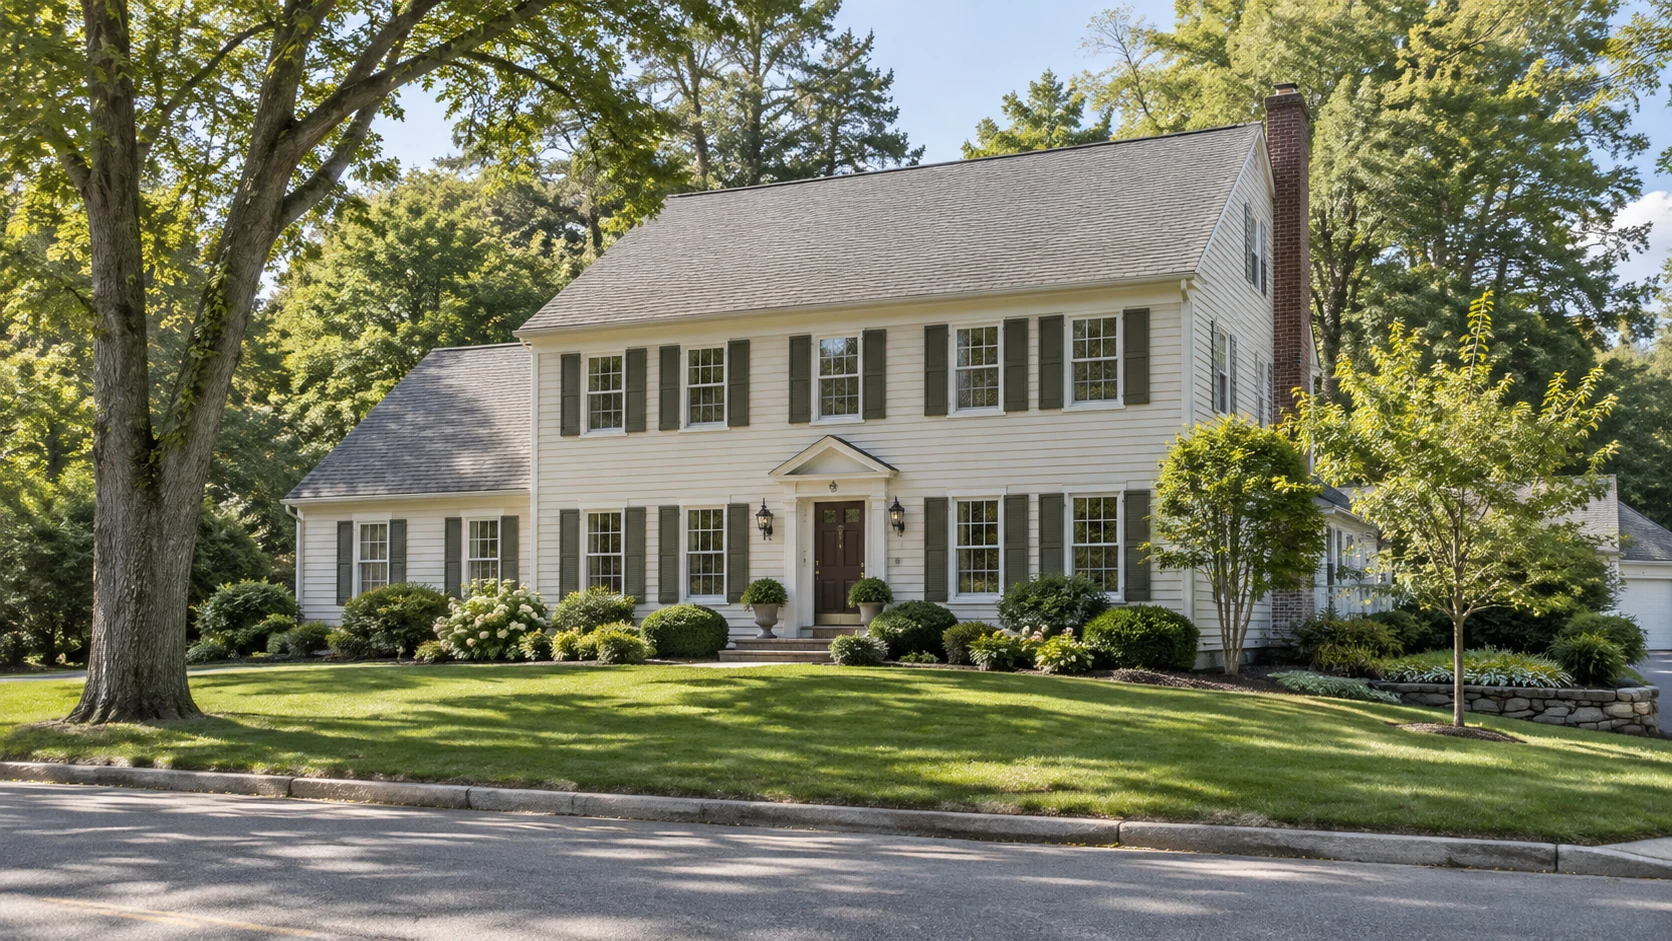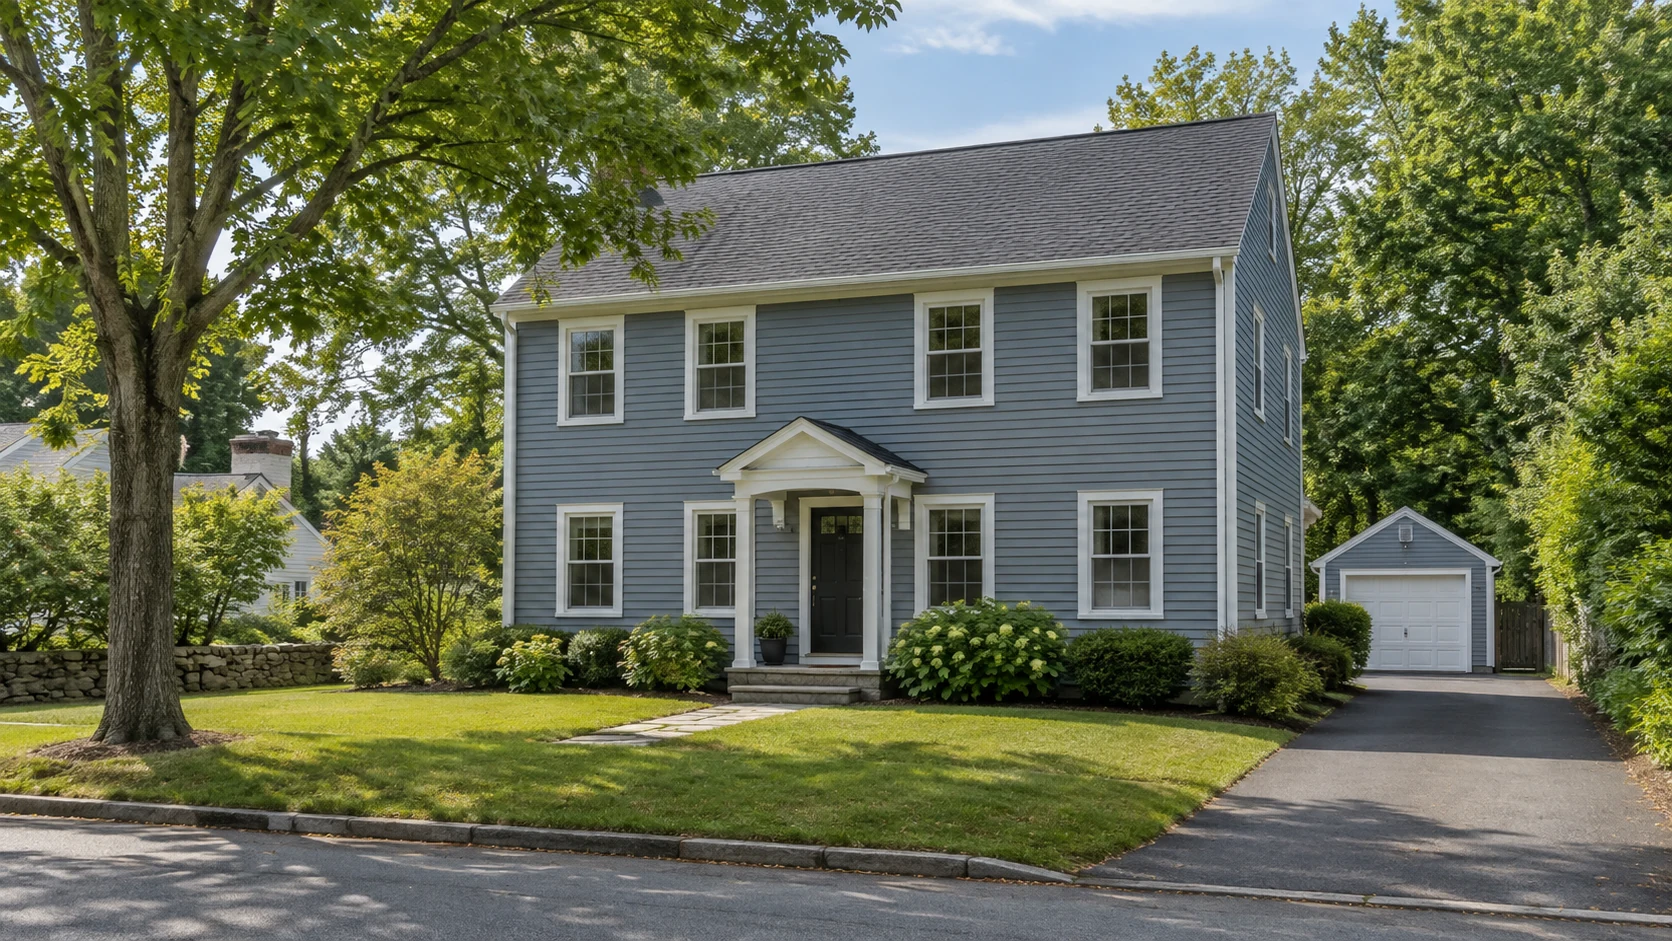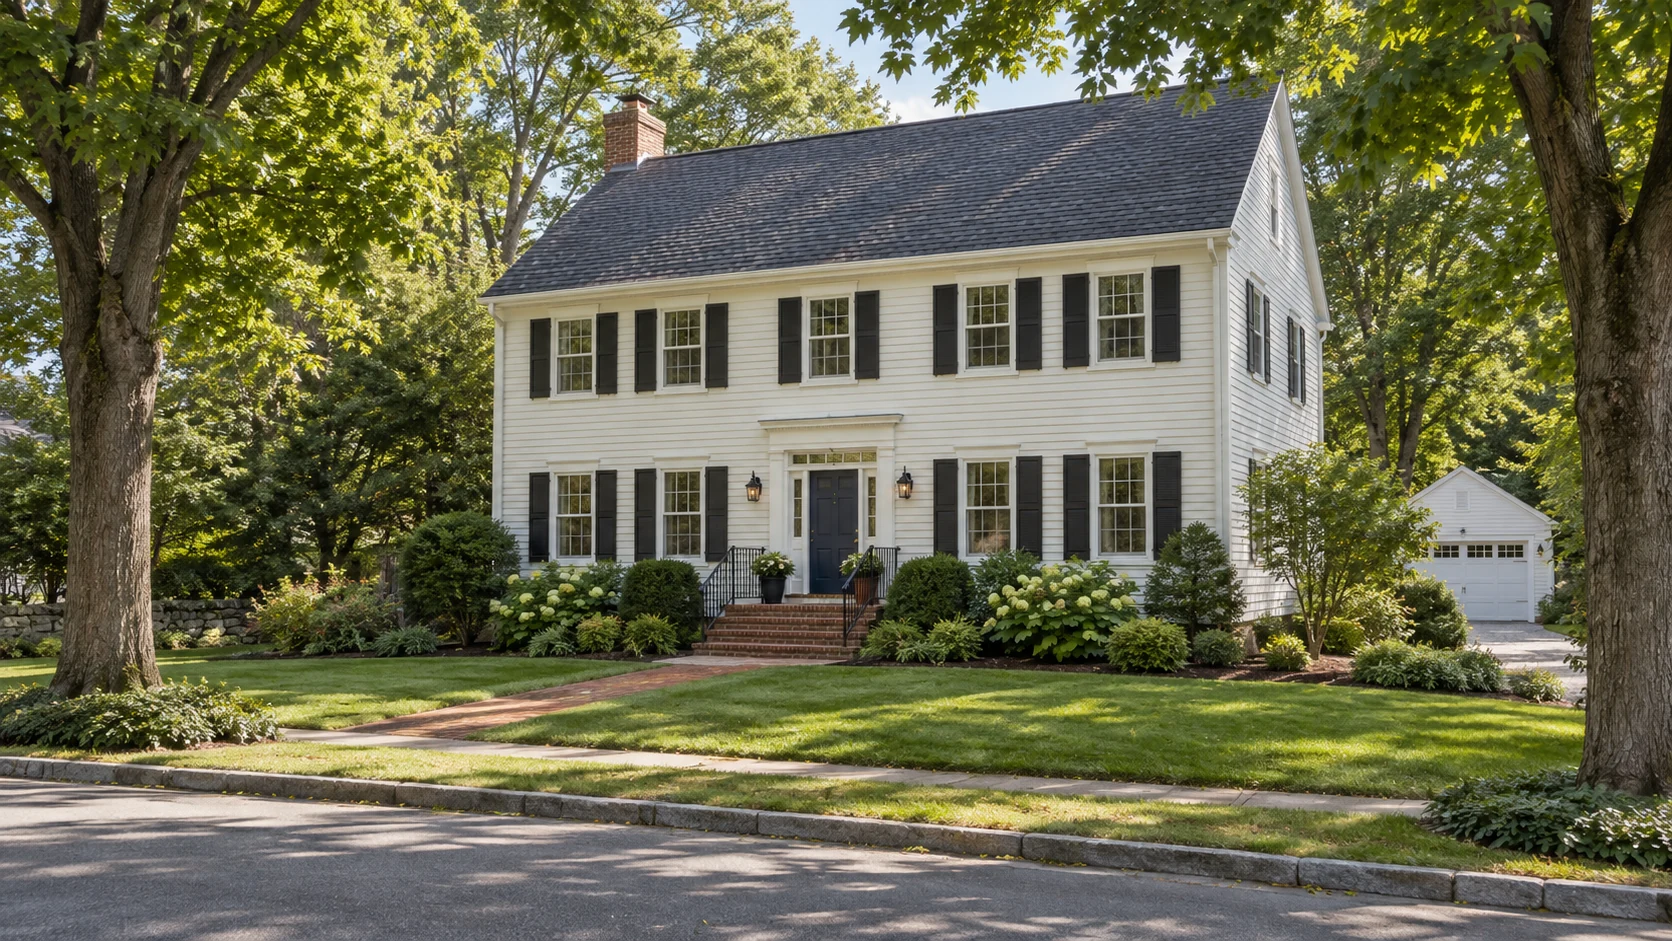
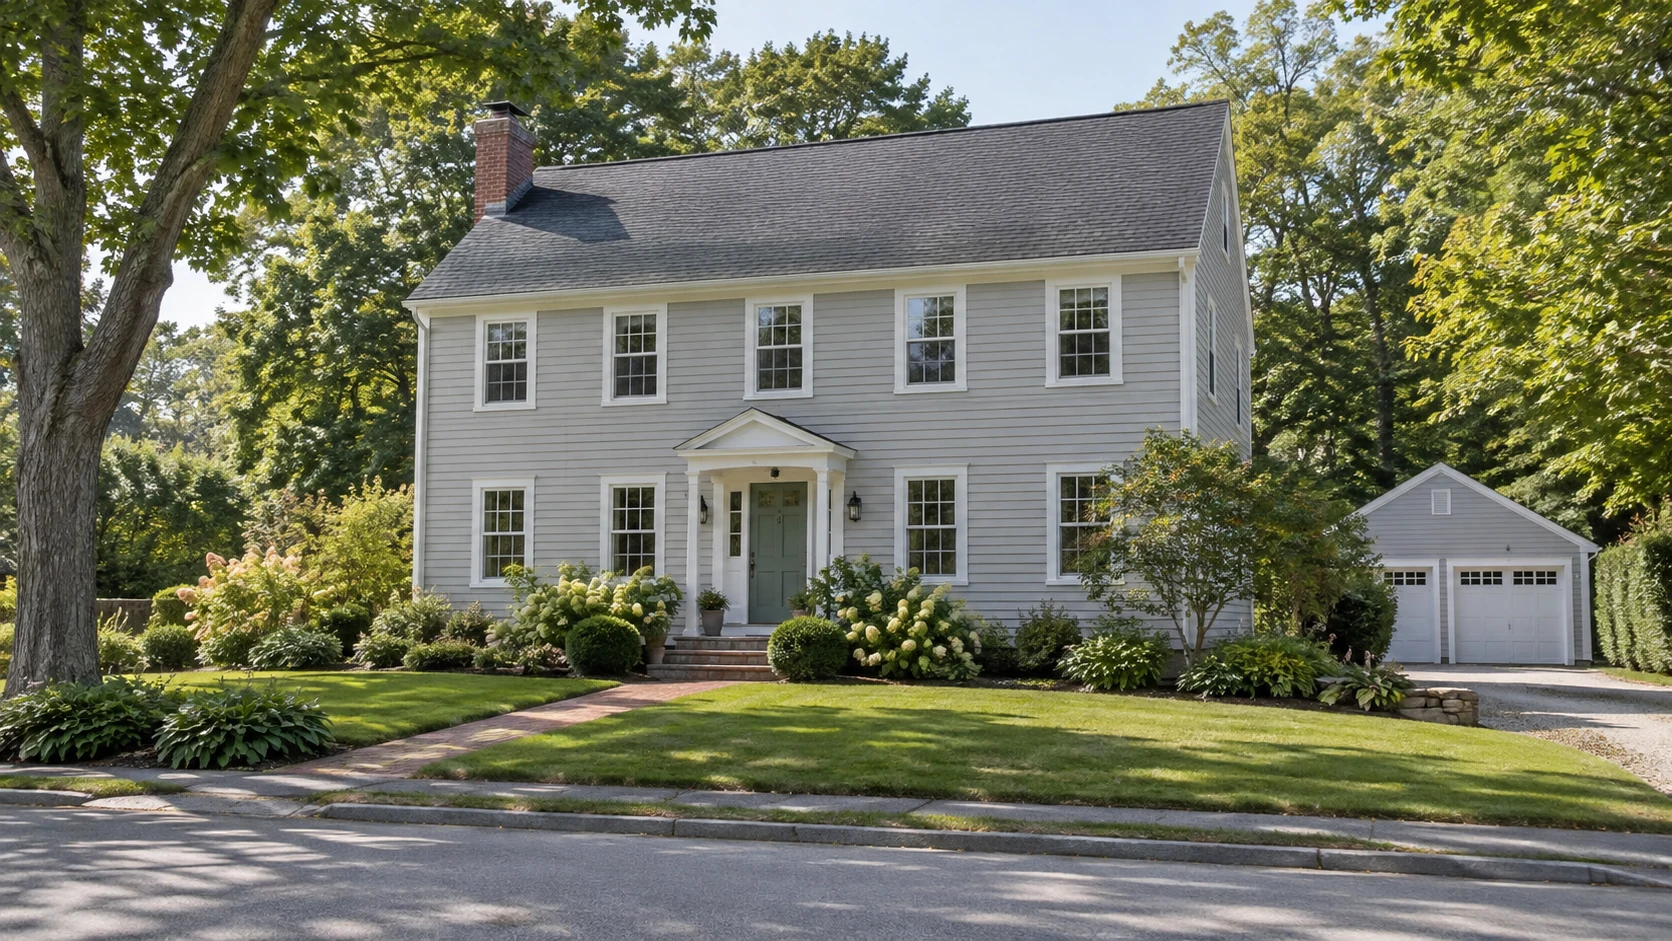
Nearby updated near-size match; baths unknown.

Illustrative sample · Fictional properties and figures · AI-generated property images
Presented by Elad Bushari · Compass
Comparative Market Analysis
North Sampleton, Sampleton · single-family · 2,400 SF · 4/2.1 · built 1988
This fictional example follows an updated colonial with 2,400 square feet of living area and a separate 300-square-foot finished lower level. Four bedrooms, two full baths and one half bath illustrate the property details considered alongside comparable sales.
This example shows how a reviewed set of four sample sales is narrowed to three comparables, with property details available for each.
Nearby updated near-size match; baths unknown.
Smaller home, fewer bedrooms, less garage and finished basement.
The comparison grid brings property differences into one view. This illustrative report uses unadjusted sample prices; a property-specific review would verify missing details and support any dollar adjustments with evidence.
Each row compares the subject with the comparable. + upward: the comparable lacks something the subject offers · − downward: it offers more.


1 / 3
| Element | Subject | 12 Market St | 18 Market St | 7 Grove Rd |
|---|---|---|---|---|
| Sale price | $905,000 asking | $900,000 | $950,000 | $860,000 |
| Conditions of sale | active listing | arms length | arms length | arms length |
| Market conditions (time) | as of today | 2026-04-01 | 2026-03-15 | 2026-02-22 |
| Location · neighborhood / ZIP | North Sampleton / 02000 | North Sampleton / 02000 | North Sampleton / 02000 | North Sampleton / 02000 |
| Waterfront | no | no | no | no |
| GLA | 2,400 SF | 2,350 SF | 2,650 SF | 2,200 SF |
| Bedrooms | 4 bd | 4 bd | 4 bd | 3 bd |
| Baths · full | 2 full | — | — | — |
| Baths · half | 1 half | — | — | — |
| Condition | good | good | good | average |
| Quality | average | average | average | average |
| Year built / eff. age | 1988 (eff. 8) | 1985 (eff. 9) | 1986 (eff. 8) | 1982 (eff. 11) |
| Parking · garage | 2 gar | 2 gar | 2 gar | 1 gar |
| Parking · open | 0 open | 0 open | 0 open | 0 open |
| Parking · carport | 0 cpt | 0 cpt | 0 cpt | 0 cpt |
| Garage · attached premium | detached | detached | detached | detached |
| Outdoor · yard | no | no | no | no |
| Outdoor · roof deck | no | no | no | no |
| Outdoor · deck | no | no | no | no |
| Outdoor · patio | no | no | no | no |
| Outdoor · porch | no | no | no | no |
| Outdoor · balcony | no | no | no | no |
| Fireplaces | 0 | 0 | 0 | 0 |
| Central air | yes | no | no | no |
| Laundry | no / bldg | no / bldg | no / bldg | no / bldg |
| Pool | no | no | no | no |
| Lot size | 9,000 SF | 9,100 SF | 9,500 SF | 8,000 SF |
| Elevator | no | no | no | no |
| Adjusted value | $900,000 | $900,000 | $950,000 | $860,000 |
Explore the sample prices side by side and across time. These charts illustrate the report format, rather than current market conditions.
Each comparable’s actual sale price, walked to the subject’s terms — the adjusted values converge on the estimate
Actual sale price Adjusted to the subject’s terms Value range
Every sale reviewed for this analysis, with the selected comparables highlighted
Selected comparable Other reviewed sale
This fictional example presents a $900,000 central value within an $880,000–$930,000 range. An actual pricing recommendation would connect verified property facts and comparable evidence with current competition, potential future inventory and market momentum.